
A Deep Dive On U.S. Healthcare Spending & Insurance Disparities
A widening health care spending gap between high-income and low-income Americans may be telling the insurance industry as much about access to care as it does about the cost of care.
Health Spending Is Growing, But Not Equally
A recent Health Affairs analysis of U.S. health care spending from 2005 through 2023 found a striking divide. After adjusting for age, health status and chronic conditions, annual real health care spending grew 1.8% among people in the highest income quintile. Among those in the lowest income quintile, there was essentially no growth.
The difference becomes even more revealing when the researchers divided the study period into smaller windows. During 2013 through 2017, when major Affordable Care Act coverage expansions were taking effect, adjusted spending among the lowest-income group grew 4.4% annually, compared with just 0.7% among the highest-income group.
Then the pattern changed again. From 2018 through 2023, spending among the highest-income group increased 2.5% annually while spending among the lowest-income group declined 2.5% annually. By 2023, the adjusted per-person spending difference between the highest and lowest income quintiles exceeded $4,700.
For agents, agencies and carriers, the takeaway should not simply be that wealthier people are spending more. The more important question is why lower-income Americans appear to be consuming less care, particularly in areas where patients have more discretion over whether, when and how they obtain treatment.
“The slowdown in overall health spending masks an increased concentration of spending among the highest-income Americans.”
First, Understand What “Spending” Means
There is an important distinction for insurance professionals. The Health Affairs analysis is not simply measuring what consumers paid out of pocket. The Medical Expenditure Panel Survey data capture direct payments for medical services from multiple sources, including insurance payments and patient payments.
That means a reduction in spending among lower-income consumers should not automatically be interpreted as improved affordability or better cost control. It may also reflect fewer services being received, changes in insurance coverage, different reimbursement levels, barriers to obtaining care or patients postponing treatment they would otherwise use.
The researchers themselves cautioned that the study did not separate changes in utilization from changes in prices. That distinction matters enormously. A patient receiving fewer prescriptions because a medication is no longer necessary is very different from a patient receiving fewer prescriptions because the medication has become difficult to afford or access.
Prescription Drugs Show One of the Sharpest Divides
Prescription spending offers perhaps the clearest example. From 2018 through 2023, adjusted prescription drug spending increased 4.2% annually among people in the highest-income quintile. Among people in the lowest-income quintile, it fell 7.4% annually.
That difference deserves attention because prescription utilization can be particularly sensitive to affordability, benefit design, formularies and the ability of patients to navigate the health care system. It can also influence future claims. When necessary medications for chronic illnesses are delayed, rationed or abandoned, today's lower pharmacy expenditure can potentially become tomorrow's more serious medical event.
Separate affordability research reinforces the importance of that concern. A 2026 KFF analysis of National Health Interview Survey data found that about 17% of U.S. adults in 2024 reported delaying or not obtaining health care because of cost, including people who rationed prescription drugs.
For insurers, pharmacy benefit managers and benefit advisers, this makes prescription access more than a drug-cost issue. Formulary design, prior authorization, copay structures, preferred pharmacies and communication with members can all affect whether coverage translates into actual treatment.
The ACA Period Offers an Important Clue
One of the most interesting parts of the study is what happened during the period surrounding the ACA's major insurance expansions. Lower-income health care spending accelerated substantially between 2013 and 2017, temporarily narrowing the spending difference between the highest and lowest income groups.
The study does not establish that the ACA alone caused that increase, so insurers should be careful about drawing a direct causal line. Still, the timing raises an important industry question: when coverage and financial access improve, does previously unmet demand begin flowing into the health care system?
For carriers, that possibility is highly relevant to forecasting. A newly insured or newly better-covered population may not behave like an existing book of business immediately. Members who previously postponed physician visits, diagnostic work, medications or outpatient procedures can bring accumulated needs with them when access improves.
For agents and brokers, it is also a reminder that enrollment alone is not the finish line. A policy can technically provide coverage while deductibles, cost sharing, provider availability, prescription restrictions and other practical obstacles still influence whether a client actually uses that coverage.
Lower Spending Does Not Necessarily Mean Lower Need
This may be the most important distinction for the insurance industry. Health care expenditure is partly a measure of medical need, but it is also a measure of access, prices and utilization. Those forces do not always move together.
The Health Affairs researchers adjusted their analysis for several important differences among income groups, including age, self-reported health status and the number of chronic conditions. Even after those adjustments, higher-income Americans consistently had higher spending levels.
The recent divergence was particularly evident among people younger than 65, the portion of the population where insurance arrangements vary widely among employer coverage, individual-market plans, Medicaid and periods without coverage. From 2018 through 2023, spending in this age group grew 2.7% annually among the highest-income quintile while declining 2.9% among the lowest-income quintile.
That creates an uncomfortable possibility for insurers: some apparent reductions in utilization may represent care that has been deferred rather than care that is no longer needed.
A Bigger National Spending Picture
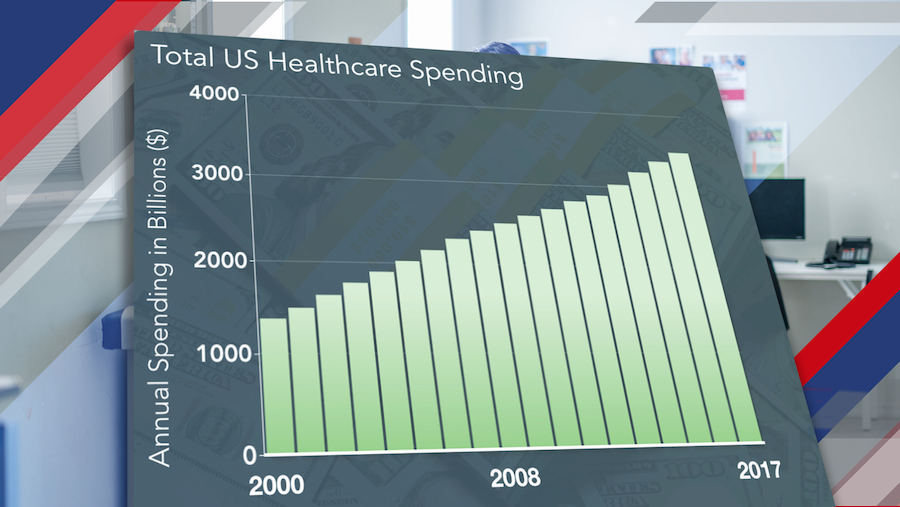
The income divide is unfolding while overall U.S. health spending continues to climb. Centers for Medicare & Medicaid Services data show national health expenditures reached approximately $5.3 trillion in 2024, or $15,474 per person. Spending increased 7.2% that year and represented about 18% of the U.S. economy.
Private health insurance spending alone reached roughly $1.6 trillion in 2024. In other words, the Health Affairs findings are not describing a health system that has broadly stopped spending. They are showing that growth can be distributed very differently across different parts of the population.
That is an important distinction for carriers evaluating aggregate medical trends. National spending growth can look strong while particular socioeconomic groups simultaneously experience flat or declining utilization. Looking only at a top-line medical cost trend can therefore hide meaningful changes beneath the surface.
What Agents, Agencies and Carriers Should Watch
- Prescription access: Falling utilization may signal affordability or benefit-design friction.
- Outpatient utilization: Income differences may reveal delayed or forgone routine care.
- Coverage transitions: Expanded access can release previously unmet medical demand.
- Total plan value: Premium alone does not determine practical affordability for members.
- Claims development: Deferred treatment can potentially contribute to later claim severity.
What This Means for the Agent Conversation
Agents are in a particularly useful position because they see the difference between a plan that looks affordable on paper and one that works for a client's actual life.
For an individual or family managing a tight budget, the lowest premium is only one part of the calculation. Prescription coverage, deductibles, specialist copays, preferred providers, expected medical needs and maximum out-of-pocket exposure can change the value equation dramatically.
The spending trends also create an opportunity for more meaningful renewal conversations. Instead of asking only whether the premium is affordable, an agent can ask whether clients have been able to fill their medications, see their doctors and obtain recommended care. Those questions may reveal coverage problems that claims totals alone cannot show.
For Carriers, Segmentation Needs More Context
For carriers, socioeconomic differences in utilization should be interpreted carefully. A population generating fewer outpatient visits or prescription claims may initially appear less costly. But lower utilization does not necessarily indicate lower underlying risk.
Understanding whether members are receiving appropriate preventive care, adhering to treatment and successfully navigating the network can provide a more complete picture than spending alone. This is where claims data, pharmacy activity, care-management engagement and access measures become more informative when viewed together.
The research may also strengthen the case for benefit designs that reduce unnecessary friction around high-value care. When affordability barriers prevent members from obtaining medications or routine treatment, shifting costs to the consumer can produce a very different outcome from eliminating genuinely unnecessary care.
There Are Important Limits to the Findings
The Health Affairs analysis is powerful, but it should not be treated as a complete explanation for income-based spending differences. The underlying Medical Expenditure Panel Survey relies partly on self-reported information, and some expenditures are imputed. The study also excludes institutionalized populations such as nursing home residents and does not capture uncompensated care.
The researchers also noted that survey changes and the COVID-19 pandemic affected data collection during portions of the study period. Less common events, including hospital admissions and emergency department visits, can have smaller sample sizes when divided across income groups.
Most importantly, the analysis identifies spending patterns rather than proving exactly what caused them. Differences in coverage, provider payment rates, income growth, prices, access and service utilization may all contribute.
The Insurance Question Is Bigger Than Who Spends More
The study offers the insurance industry a useful warning against viewing lower medical spending as an automatic success. Spending can fall because care became more efficient. It can also fall because people are not getting care.
For agents, that means helping clients evaluate whether coverage is usable, not merely purchasable. For agencies, it means paying closer attention to the practical barriers clients encounter after enrollment. For carriers, it means examining the relationship among affordability, access, utilization and future claims rather than treating each measure in isolation.
The more than $4,700 adjusted spending gap recorded between the highest and lowest income groups in 2023 is therefore more than an interesting economic statistic. It is a signal that the same health care system may be functioning very differently depending on the financial resources of the person trying to use it.
For the insurance industry, the opportunity is not simply to manage how much health care costs, but to make sure cost management does not quietly become care avoidance.